Integrated charting
TradingView charts, inside the trading workflow.
Analyse ASX securities with familiar technical tools, then continue into market depth, equities or options without rebuilding the context elsewhere.
View charting pricing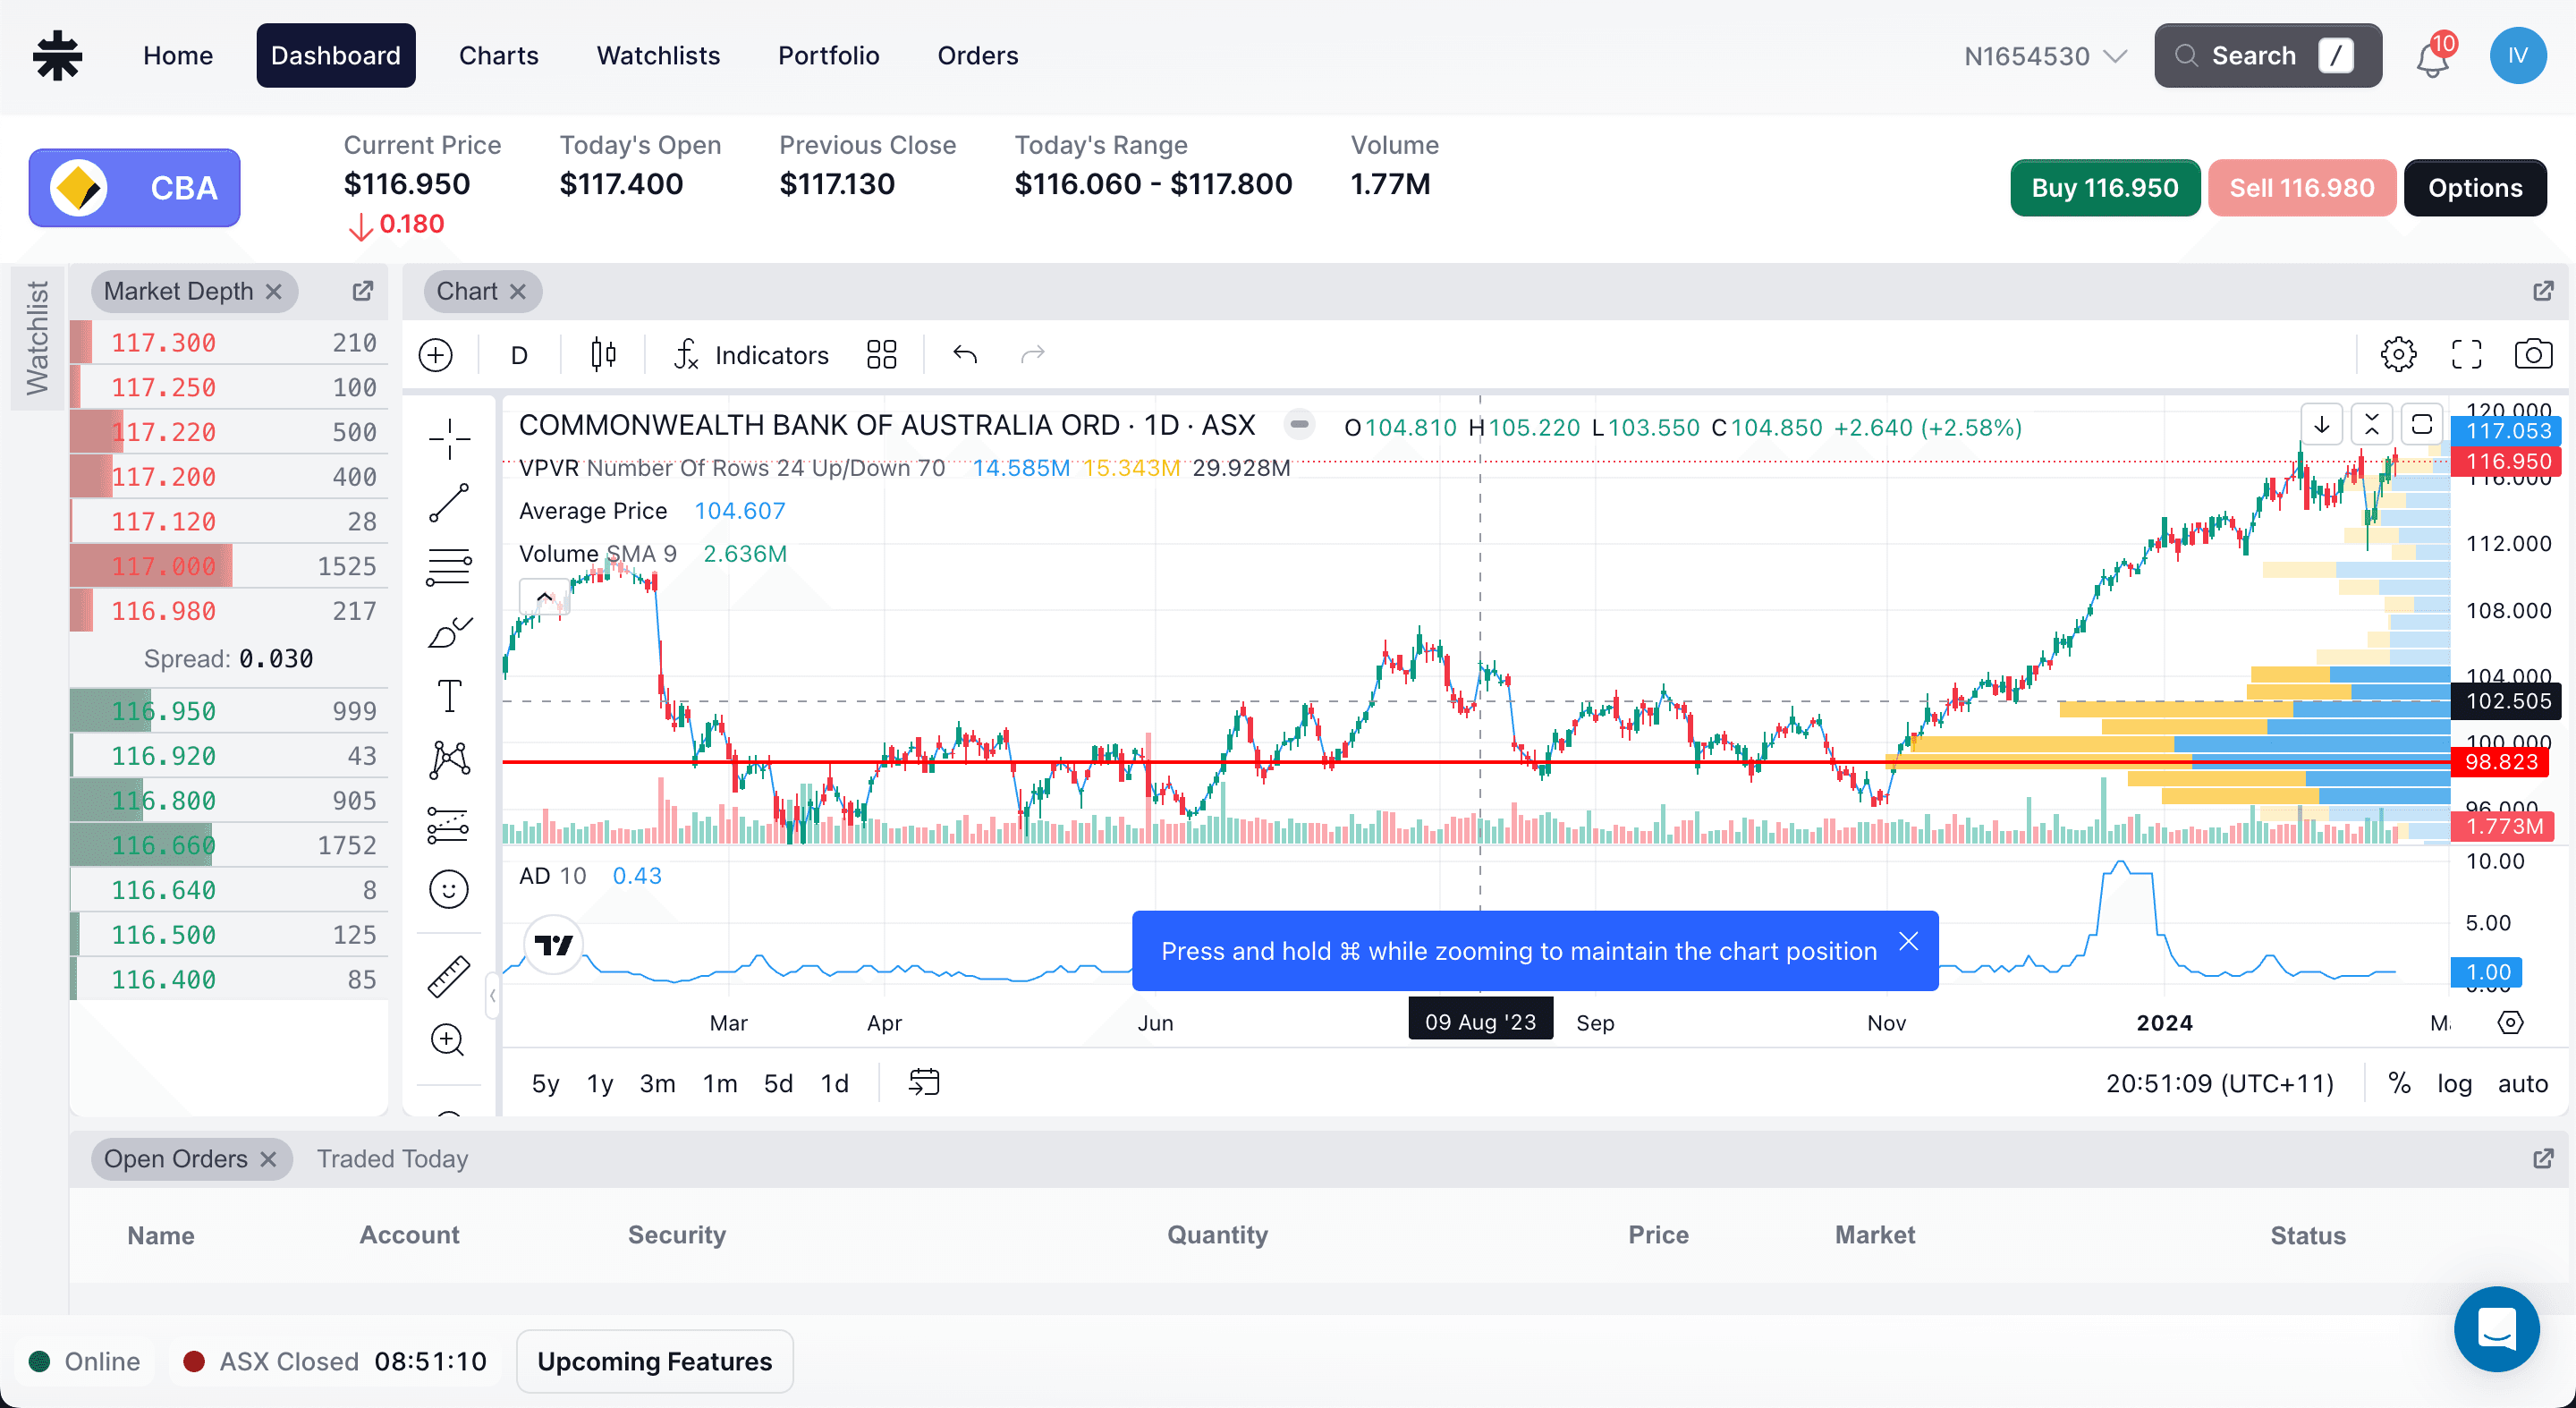
Published by Volatility Pty Ltd · Last reviewed 17 July 2026
Chart features and market data depend on the selected platform and data entitlements.
What it is
Volatility integrates TradingView charting with its own ASX data and trading account context.
TradingView supplies the charting library. Volatility supplies the connected data and account workflow. TradingView's documentation is explicit that its charting library does not itself include market data.
What the integration adds
Technical analysis
Apply TradingView's built-in indicators and drawing tools to the market data available in your Volatility account.
Market context
View charts alongside ASX prices, market depth, watchlists and company information rather than in a disconnected browser tab.
One trading workflow
Move from the chart to equities or options analysis without searching for the same security again in another application.
Does TradingView charting include live ASX data?
Charting and market-data access are separate. The chart displays the data available through the user's Volatility platform and ASX data entitlement. Review live data and pricing for the current product configuration.